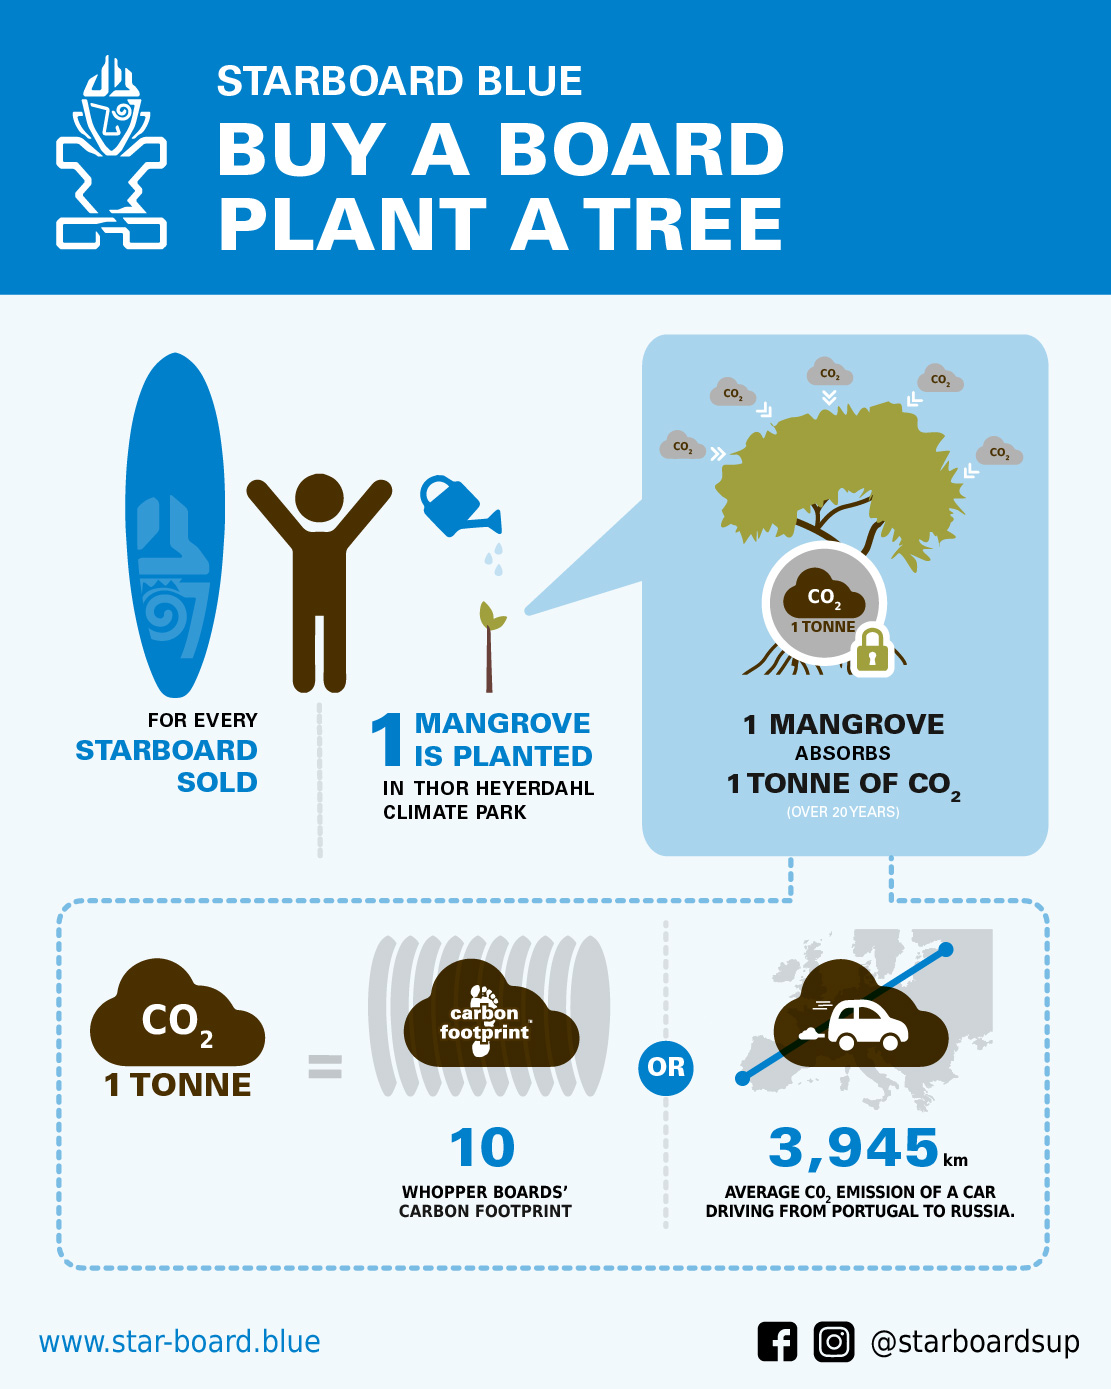

This picture is a calculation example from a past program. Current planting numbers, time periods and carbon calculations may differ from Starboard HQ's latest information.
Trees and a car appear next to a board in this picture. It's a scene from a program Starboard used to explain its environmental impact through mangrove planting.
01. What does the picture connect?
The original links board sales with mangrove planting, and compares the CO₂ one tree absorbs over 20 years with the emissions of boards and cars.
These numbers are calculation examples from the program at the time. This material isn't meant to be read as saying that buying a board in Korea today automatically comes with exactly the promise in the picture.
02. Same trees, different scope of calculation
Starboard HQ's follow-up explanation says the 20-year, 1-ton calculation used before 2021 was based on research that included the trees and the surrounding soil. It then describes calculations that reflect the VCS standard and allocation to local communities.
So the numbers in an older picture and in current information can differ. You need to read the scope and the timing together: which period the material is from, and whether it counted only the trees or the soil as well.
03. Follow the latest work in Starboard HQ's records
Treat the picture as a starting point for understanding the program's purpose, and check current planting and carbon calculations in Starboard HQ's latest explanation. We don't add up numbers from different years to make them look like a single result.
Closer to home, there's also looking after the waterfront near you and using your gear for a long time. In the ocean action link below, you can continue with Starboard HQ's story and ways to take part in Korea.
Sources and scope
The artwork is a past SB Blue mangrove infographic from Starboard; the explanation is Starboard Korea's commentary. The 1 tree / 20 years / 1 ton figures are not used as a current purchase benefit in Korea. We present them together with Starboard HQ's explanation of how its calculation method changed.
- Starboard HQ infographic: SB_Blue_V5-01.jpg ↗
- How Starboard Blue's mangrove calculation changed ↗
- Starboard HQ's mangrove program ↗
The illustration is Starboard's original artwork; the explanation is Starboard Korea's editorial guide, translated into English here. Sources checked: 2026-09-08.